

Asset class recap for December, Q4, and 2023
2023 ended with a roar as stock markets had an exceptional year and fixed income asset classes finished the year with returns near their long term averages. After a volatile January to October, strong returns in November and December saved some asset classes from having a second consecutive negative year. Lower inflation readings, an expectation for the Federal Reserve to drop interest rates in 2024, and lower energy prices came together to give the market good reasons to become more enthusiastic.

We often use the asset class “quilt chart” below to help illustrate the impact of volatility among asset classes and to show the benefits of using a diversified portfolio like the ones Advyzon Investment Management constructs for investors. As you move from left to right, from year to year, and follow the dark blue Diversified 60% equity / 40% bond portfolio, you can see that it never climbs into the top 2 or into the bottom 3 rows in any year. Occasionally, there are articles from reporters or product manufacturers with an expensive new alternative product idea that claim that the “60/40 portfolio is dead”, but the evidence over the last 13 years (shown in the farthest right column) shows that a Diversified portfolio has continued to perform quite well, at the third highest returning spot in our chart.
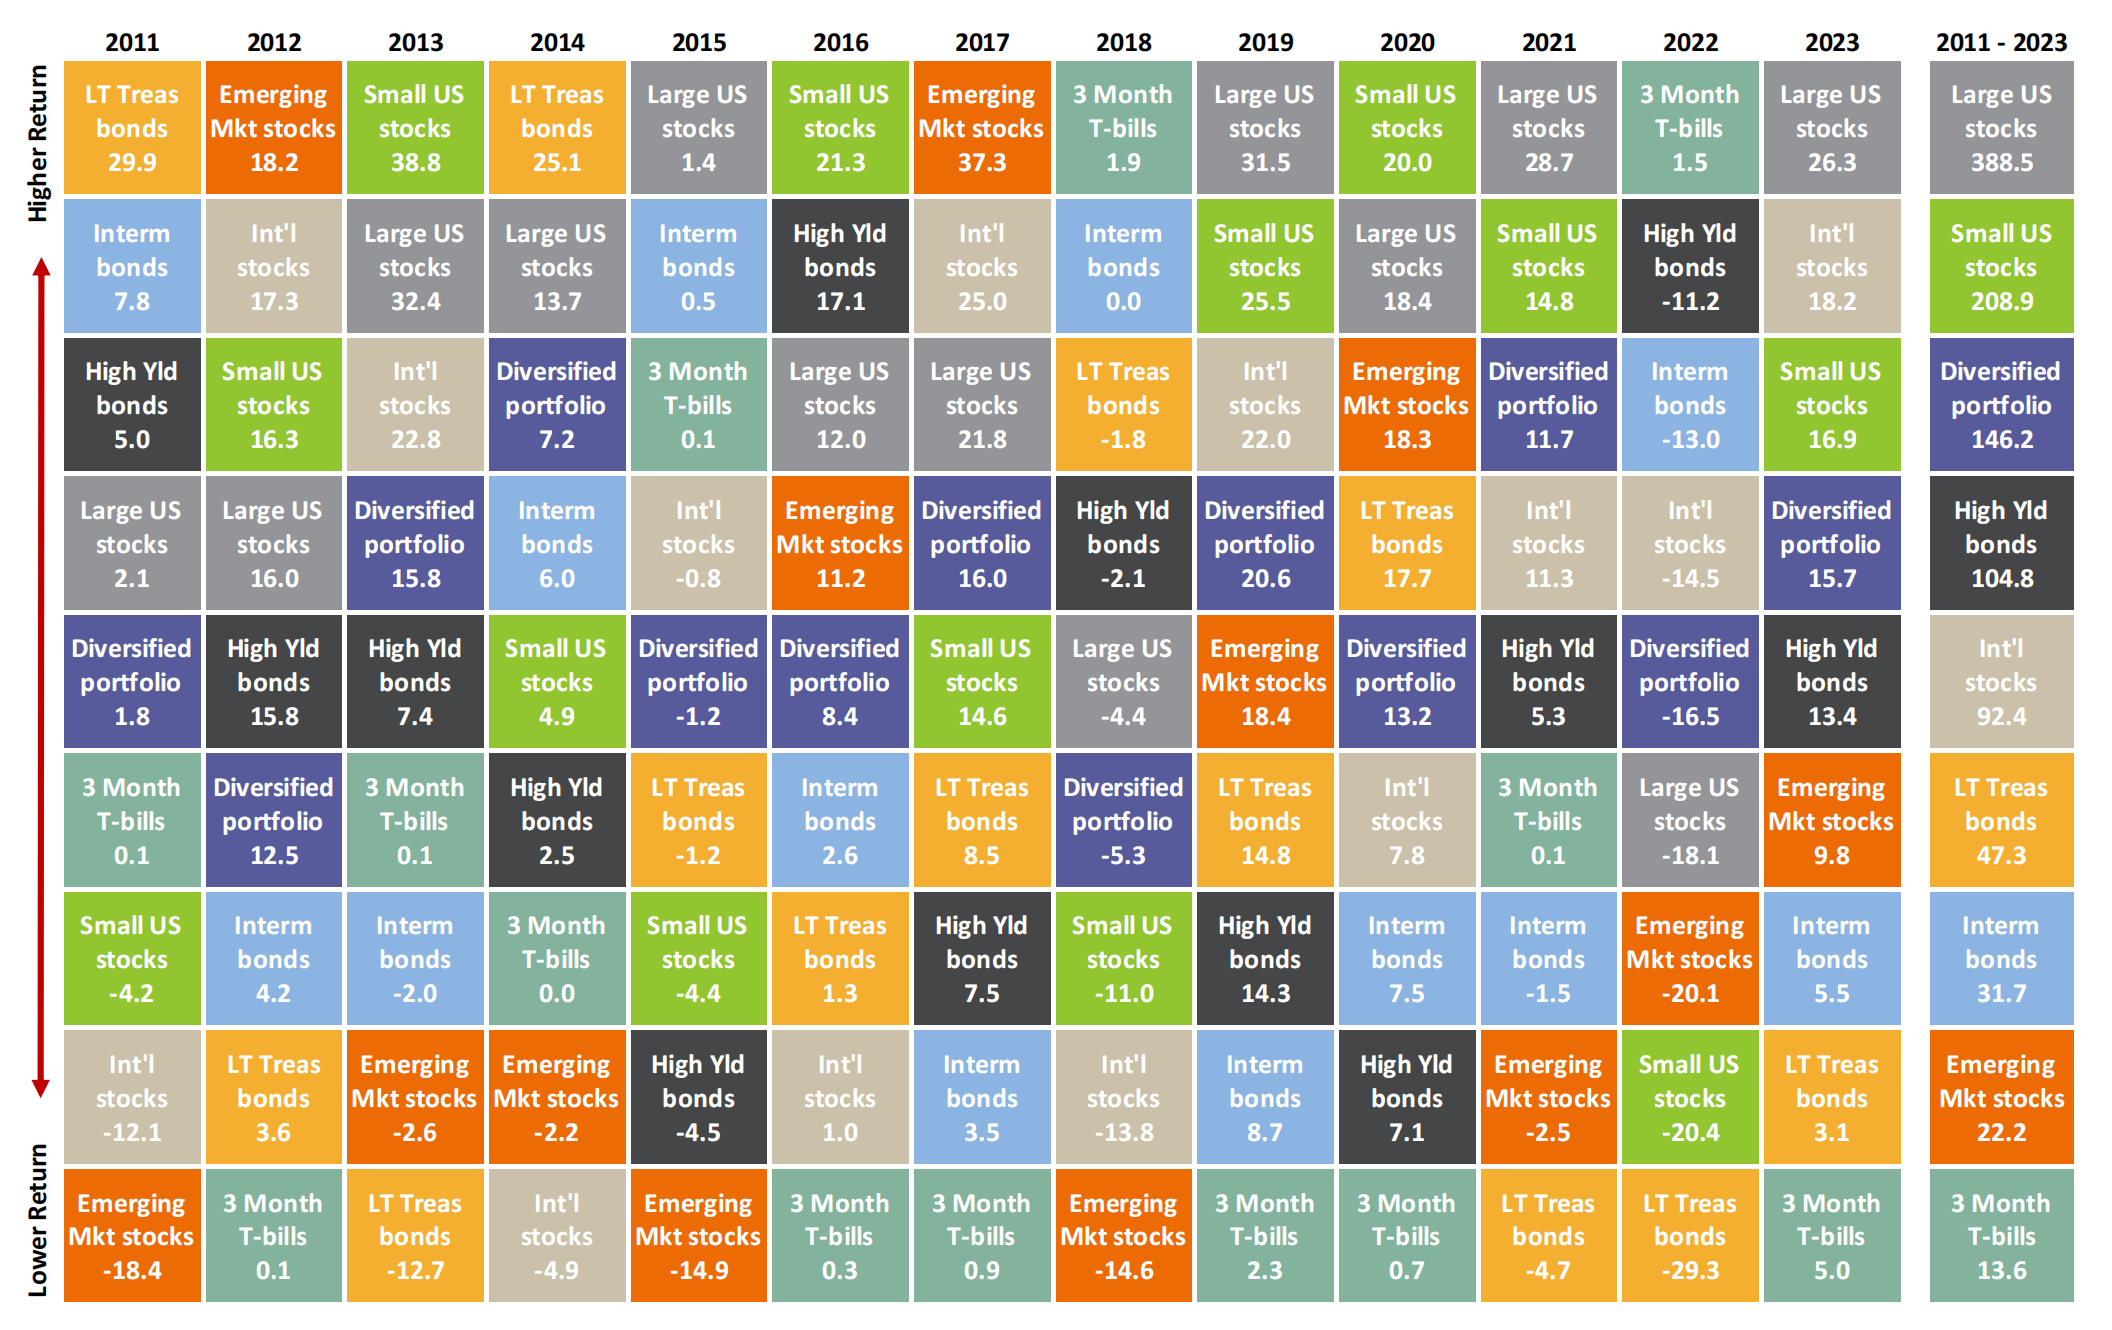
Notes: Large US stocks are represented by the S&P 500 index. Small US stocks are represented by the Russell 2000 index. International stocks are represented by the MSCI EAFE index. Emerging Market stocks are represented by the MSCI EM index. High Yield bonds are represented by the Bloomberg US Corporate High Yield index. Long Term Treasury bonds are represented by the Bloomberg Long Term US Treasury index. Intermediate bonds are represented by the Bloomberg US Agg Bond index. 3 Month T-bills are represented by the ICE BofA US 3M Trsy Bill index. The Diversified Portfolio is calculated as a 60% equity and 40% bond portfolio of the previously listed indexes with respective weights of 33%, 7%, 14%, 6%, 8%, 6%, 25%, and 1%.
Timing Risk – Diverse outcomes for accounts opened in 2021 to 2023
Investors and advisors are seeing a wide disparity of results for accounts that were opened within the last few years. As an account’s investment horizon grows, diversified portfolios have a lower and lower probability of loss of principal. However, every account has a start date and sometimes the first few years can be very uncomfortable if the account happens to be unlucky and experience bad returns in the first year or two after its start date.
Investors who opened new accounts around the equity market peak of January 2022 are likely to have received a 12/31/2023 statement that is lower than their initial contribution and they are likely to be highly aware of it. Conversations with advisors can be unfortunately uncomfortable unless the advisor has spent time up front, explaining market risks and how they can be mitigated with time.
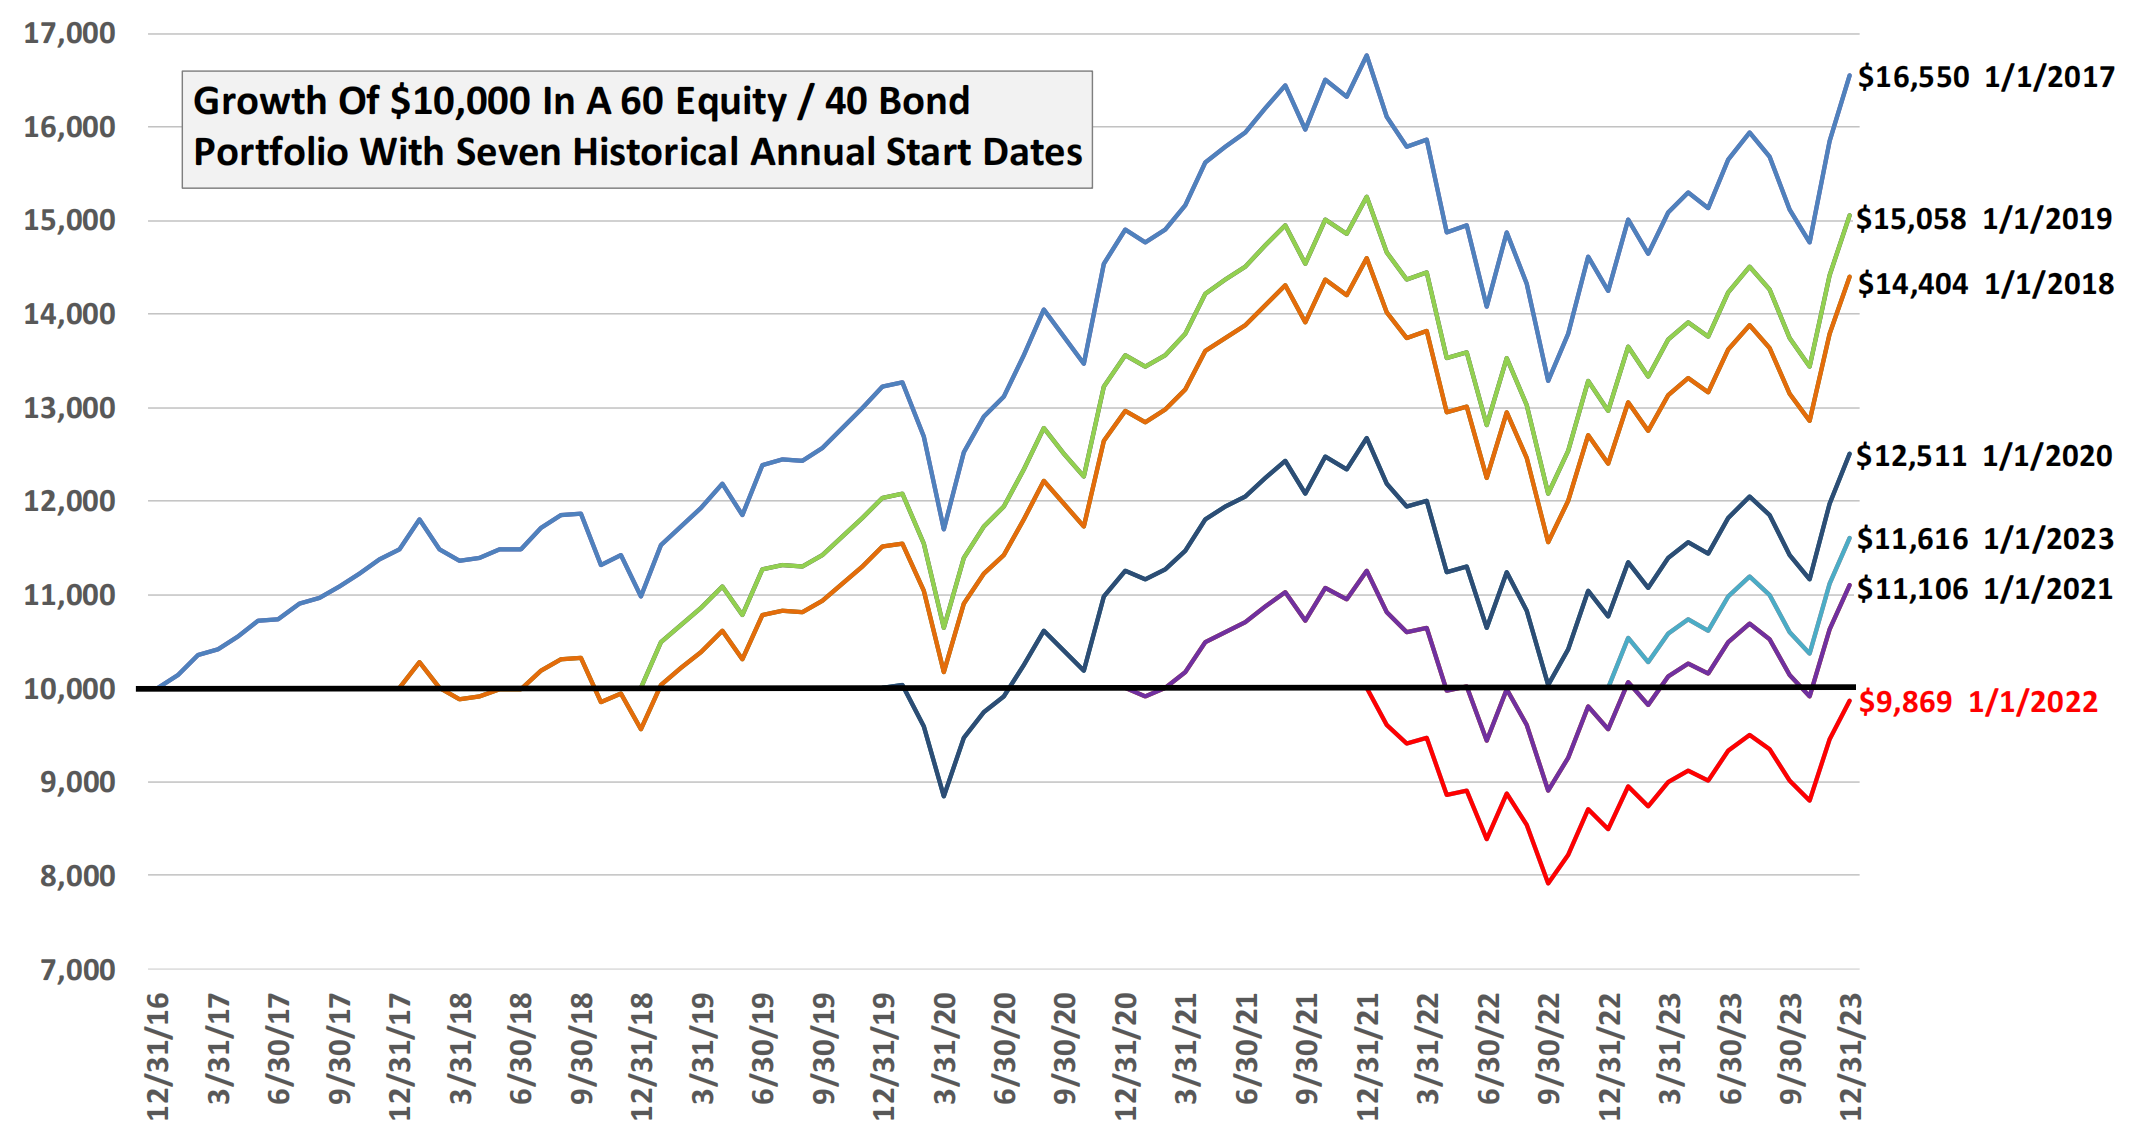
To illustrate how timing has effected investors, the chart below shows the growth of $10,000 for a 60% Equity and 40% Bond diversified portfolio with start dates of each of the last seven calendar years. In a perfect world with little volatility, we would expect older portfolios to end up with higher ending values, but that is not what we witness. The stock market drawdown of 2018 has shuffled the total value of accounts opened in early 2018 below those opened in early 2019. Even worse, many accounts that were opened in early 2022 are currently worth less than their opening amount – two years later. When holding year-end review meetings with clients, advisors need to prepare for some conversations to be breezy and some to be more difficult.
Market Expectations and Portfolio Positioning
At the end of last year, I made five predictions for the market in 2023. Investors should always try to maintain a long term focus, but there are times when market pricing dislocations can offer opportunities to either add return or avoid risk and our team adjusts portfolio positioning slightly to incorporate our expectations into our investments.
- The first prediction was that the stock market would return +5% to +15% in 2023, which would have been a typical year (based on long term historical returns) and a welcome rebound from
2022’s -18.1% drawdown. The S&P returned 26.3%, exceeding expectations. There was a lot of negativity at the end of last year after the S&P 500 index dropped from to 4,766 to 3,839 during
2022, setting 2023 up for a rebound from a valuation perspective. In addition, the unexpected run up of prices for artificial intelligence related stocks gave a big return boost to investments that include mega cap stocks and the “Magnificent Seven”.
For 2024, a stock market return in the -5% to +5% range looks more likely. Among our concerns
a. Stock prices that appreciated more than 20% in 2023 left valuations for many segments of the market looking less attractive than they were at the end of last year
b. As corporate debt matures, a significant amount of it is being rolled over at higher fixed coupon interest rates causing earnings for corporations that borrow significantly to come under pressure
c. The market expects significant interest rate cuts by the U.S. Federal Reserve in 2024 which would help push prices up (prevailing yields are often used as the base for valuation model discount rates), but if the Fed moves rates down less than the market expects (our base case), then we would expect prices to appreciate less
- We predicted poor returns for some market segments that benefited from the COVID outbreak. Although the March 2020 COVID related market drop was 33 months in the rear view mirror at the end of 2022, we felt that investors were continuing to overestimate revenues and profits for some companies that had benefited from COVID related tailwinds. We suggested underweighting the Healthcare Sector and stocks like Peloton, which had a massive pull-forward in demand as a result of people staying at home. The S&P 500 Healthcare Sector index returned a paltry 2.1% in 2023 and the price for Peloton Interactive stock (ticker PTON) dropped from $7.94 at the start of the year to $6.09 at 12/31/23, for a return of -23%.
Now that the March 2020 COVID market drawdown was nearly 4 years ago, its economic effects are largely behind us and market segments that were impacted positively or negatively have likely settled back toward an equilibrium supply and demand level and overall stock price level.
For 2024, we expect the financial stock sector is likely to outperform the overall market. When the yield curve is upward sloping, banks have a much easier time generating profits. For many financial corporations, their main line of business is borrowing at short term rates and lending at longer term rates. The yield curve has been inverted and flat for a couple years but this is unwinding. We expect financial stocks to benefit from a shift back toward a normal, upward sloping yield curve. The S&P 500 Sec/Financials Sector index trailed the overall S&P 500 stock index by 14.1% last year and may be due for a rebound.
We predicted that international stocks would outperform U.S. stocks in 2023. We were wrong on this one. The MSCI EAFE diversified index of non-US stocks had a very good year, returning
2%, but did not keep up with the S&P 500’s return of 26.3%. The U.S. is the clear leader in technology development, and while many chip makers are located outside the U.S., the majority of the beneficiaries of A.I. related innovation have been U.S. companies.We vary the international exposure in our portfolios between 20% and 40%, based on our expectations for relative performance. Among equities, we are currently allocating roughly 33% to non-U.S. We are not seeing clear reasons to modify our exposure up or down for 2024.
We predicted that bonds would have a below average year. The Bloomberg U.S. Aggregate Bond index returned 5.5% in 2023 and did underperform its average since 1980 of 7.0%. The yield
on a 10 Year Treasury Bond started 2023 at 3.88% and ended 2023 at 3.87%, resulting in very little price change for most intermediate term bonds. The 5.5% total return for diversified bonds was the result of a combination of coupon payments on guaranteed treasury bonds, slightly risky mortgage backed bonds, and riskier corporate bonds that pay higher coupon payments.For 2024, we expect intermediate term bonds to see a repeat performance of 2023. Unless there is an unexpected shock to financial markets, we do not see a reason that intermediate rates should go up or down significantly, so we expect prices to remain steady and we expect total returns to be driven primarily by coupon payments, like 2023. Many economists expect the Fed to cut short term rates 6 times during 2024, but we think that may be wishful thinking. The Fed is very data dependent and we believe 2 or 3 cuts may be more likely for 2024 - and only then if inflation drops below its current 3% annual rate. Those short term rate adjustments by the Fed would not impact intermediate term rates because they are already baked into current expectations. This would lead bonds to have another slightly below average, but very reasonable total return for 2024.While most economists were predicting a recession for 2023, we said, “The economy may fall into another technical recession in 2023 and make headlines in the press, but it is unlikely to be felt severely by most US citizens and have a meaningful impact on corporate earnings.” The U.S. economy produced positive and steady GDP growth for the last four quarters, ending nowhere near recessionary territory.

GDP is measured as the sum of Consumer Spending + Government Spending + Investments + U.S. Exports – U.S. Imports. Various economists predicted cutbacks in various segments of GDP
for various reasons, but there were two factors of growth that we expected to contribute disproportionately positively; higher Consumer Spending largely from increasing numbers of
immigrants, and continued high deficit Government Spending. 2024 is an election year and we may see a reduction in immigration (legal + illegal) that could slow economic growth slightly, but we do not expect a reduction in Government Spending. Overall, we expect healthy GDP growth in 2024 that will help corporate earnings continue to grow.
Important Disclosures
Opinions expressed are as of the current date; such opinions are subject to change without notice. Advyzon Investment Management shall not be responsible for any trading decisions, damages, or other losses resulting from, or related to, the information, data, analyses or opinions or their use. This commentary is for informational purposes only. The information, data, analyses, and opinions presented herein do not constitute investment advice, are provided solely for informational purposes and therefore are not an offer to buy or sell a security. Please note that references to specific securities or other investment options within this piece should not be considered an offer (as defined by the Securities and Exchange Act) to purchase or sell that specific investment or a recommendation for a particular product.
Performance data shown represents past performance. Past performance does not guarantee future results. All investments involve risk, including the loss of principal. There can be no assurance that any financial strategy will be successful. This commentary contains certain forward-looking statements. We may use words such as “expects”, “anticipates”, “believes”, “estimates”, “forecasts”, and similar expressions to identify forward-looking statements. Such forward-looking statements involve known and unknown risks, uncertainties and other factors which may cause the actual results to differ materially and/or substantially from any future results, performance or achievements expressed or implied by those projected in the forward-looking statements for any reason.
Investment management and financial advice offered by Advyzon Investment Management is intended for citizens or legal residents of the United States or its territories. Investing in securities involves risks, including but are not limited to; currency risk, political risk, geographic risk, concentration risk, custody risk, asset class risk, management risk, market risk, operational risk, passive investment risk, securities lending risk, tracking error risk, tax risk, valuation risk, and infectious illness risk. Investing in emerging markets may increase these risks. Emerging markets are countries with relatively young stock and bond markets. Typically, emerging-markets investments have the potential for losses and gains larger than those of developed-market investments. A debt security refers to money borrowed that must be repaid that has a fixed amount, a maturity date(s), and usually a specific rate of interest. Some debt securities are discounted in the original purchase price. Examples of debt securities are treasury bills, bonds and commercial paper. The borrower pays interest for the use of the money and pays the principal amount on a specified date. High yield debt (non-investment grade or junk bonds) can be more risky than higher rated debt, typically has a higher default rate than investment grade and treasury debt, and high yield funds can lose principal.
“SBBI” stands for “Stocks, Bonds. Bills, and Inflation”. “Stocks, Bonds, Bills, and Inflation”, “SBBI”, and “Ibbotson” (when used in conjunction with a series or publication name) are registered trademarks of Morningstar, Inc. ©2021 Morningstar.
“CRSP” stands for Center for Research in Security Prices. Part of the University of Chicago’s Booth School of Business, the CRSP is a nonprofit organization that is used by academic, commercial, and government agencies to access information such as price, dividends, and rates of returns on stocks.
The indexes noted are unmanaged and cannot be directly invested in. Individual index performance is provided as a reference only. Since indexes and/or composition levels may change over time, actual return and risk characteristics may be higher or lower than those presented. Although index performance data is gathered from reliable sources, Advyzon Investment Management cannot guarantee its accuracy, completeness or reliability.